Christina Chappetta
Today
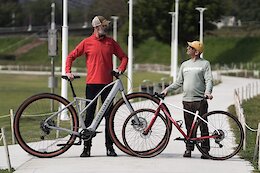
 Video: Why You Should Give A SH!T About Bike Festivals Like Sea Otter
With roots dating back to 1991, the Sea Otter Classic is one of the biggest biking events of the year.
Neko Mulally
Today
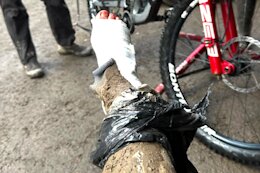
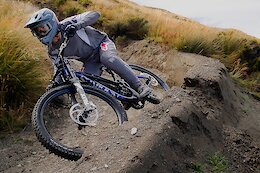
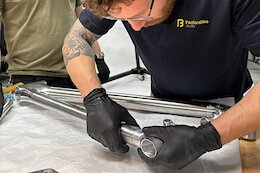 Video: Neko Mulally On Frameworks' First Bonded Downhill Frame
Frameworks' first attempt at a bonded lug and tub frame.
COMMENCAL BIKES & SKIS
Today
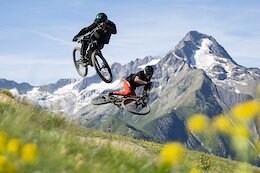 Video: So Much Style As Hugo Frixtalon & Brendan Howey Hit Les 2 Alpes
An exceptionally stylish duo.
Outside Online
Today
 Sign Up for the Pinkbike Newsletter - All the Biggest, Most Interesting Stories in your Inbox
The homepage can be a lot to keep up with.
Sarah Moore
Today
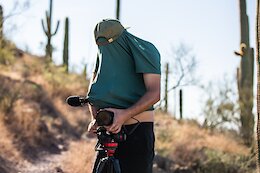
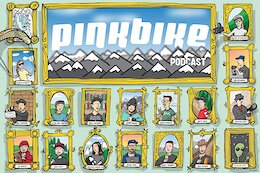 The Pinkbike Podcast: Getting to Know Henry Quinney
The tables have turned on this week's podcast, as it's Henry's turn to be asked the questions.
Bowheadcorp
Today
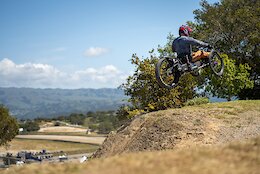 Video: Cole Bernier on Recovering from Injury & Racing Adaptive MTBs at Sea Otter
In the summer of 2022 Cole Bernier had to be admitted to hospital to repair an ongoing pressure sore. 2023 marked his return to doing what he loves.
Saracen Bikes
Today
 Saracen Announces Amplitude AL Elite & 3 New Dirt Jump Colours
Saracen's latest release of dirt jump bikes.
PROPAIN-Positive
Today
 Video: Pre-Season Training Camp in Athens with the 2024 Propain Positive Crew
The crew gets together for the first time for a pre-season training camp in Athens, Greece.
Nick Bentley
Today
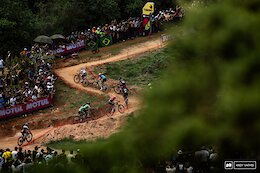
 Race Report: Brutal Conditions at British Downhill National Series Round 1 Rheola
Due to a large number of red flags and numerous injuries keeping all of the onsite medical team busy, the decision was made to cancel race runs.
Sarah Moore
Apr 16, 2024
 Pinkbike Primer: Everything You Need to Know Ahead of the Araxá XC World Cup 2024
Here is everything you need to know ahead of the second round of the 2024 XC World Cup.
Dario DiGiulio
Apr 16, 2024
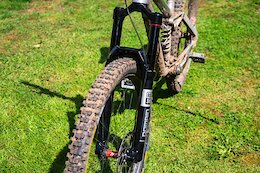 First Ride: The Sub-$600 RockShox Domain and Psylo Forks
These low-cost alternatives to the Lyrik and Zeb might just be worth a second look.
Matt Beer
Apr 16, 2024
 Review: Race Face's Era Chainring Uses Steel, Carbon, & Aluminum
The new Era chainrings boast impressive durability at a light weight, but they don't come cheap.
Sarah Moore
Apr 16, 2024
 Things We Learned from the State of the Sport Survey
Now that the dust has settled on the State of the Sport survey, we reflect on what we learned this year.
Mike Kazimer
Apr 16, 2024
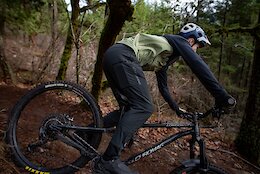
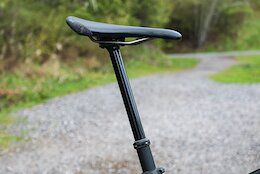 First Ride: Fox's New Transfer Dropper Post - Adjustable Travel, Up to 240mm of Drop
The Transfer gets a complete overhaul for 2025.
Outside Online
Apr 5, 2024
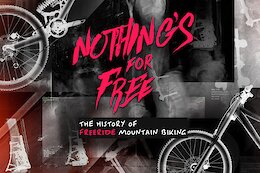 Nothing's For Free Available for Pre-Order on iTunes
The iconic history of freeride will be available to own from April 23rd.
Cannondale Bikes
Apr 16, 2024
 Video: Texas BBQ, Biking & Country Music with Mitch Ropelato in Season 3 of 'Mitch'n Out'
Mitch Ropelato kicks off season three by heading down south to take that all in, check out the local riding scene and even write his first country song!
Chromag Bikes
Apr 16, 2024
 Chromag Announces 2024 Clothing Line
New pants and jerseys from Chromag for 2024.
TRPCyclingComponents
Apr 16, 2024
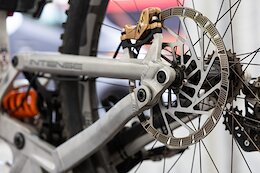 TRP Cycling Releases New S05E Race Rotor
The rotor uses a new hole pattern which TRP says improves heat management.
iXS
Apr 16, 2024
 iXS Announces New Hex Pull-Over Protector
iXS says their new back protector offers both high protection and great ventilation, making it suitable for the bike park or enduro races.
Mike Kazimer
Apr 15, 2024
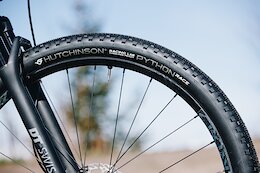 Hutchinson Releases New Python 3 & Python Race XC Tires
Two new fast-rolling options from the French tire specialists.
Sarah Moore
Apr 15, 2024
 Gwendalyn Gibson Broke Collarbone in Crash at Mairiporã XC World Cup 2024
Gwendalyn Gibson had surgery in Brazil after a third lap crash.
Sarah Moore
Apr 15, 2024
 5 Things We Learned from the Mairiporã XC World Cup 2024
Team USA had more success than ever before, the battle to secure two Olympic spots is on, and why it's harder for some people to make their country's Olympic team.
Ed Spratt
Apr 15, 2024
 Race Analysis: Elite XCO at the Mairiporã XC World Cup 2024
The opening round of the 2024 XC World Cup provided incredible scenes as riders battled for race-winning glory and rare Olympic team spots.
Sarah Moore
Apr 15, 2024
 Tree Root Pierces Harriet Harnden's Foot at Round 1 of the British National Downhill Series
Harriet Harnden's foot clipped a root sticking out into the track and went though her shoe.
Digit Bikes
Apr 15, 2024
 Digit Announces New Ring Trail Bike
The Ring has 128mm of travel, a 140mm fork, and 29" wheels.
Ed Spratt
Apr 15, 2024
 XCO Photo Epic: Mairiporã XC World Cup 2024
The 2024 World Cup season starts in dramatic fashion.
Henry Quinney
Apr 15, 2024
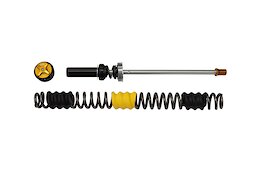 Ohlins Release RXF38 & DH38 Conversion Kits
New spring cartridges are now available for Ohlins' DH and enduro forks.
 Help Support WMBC with the Fanatik $10K Shopping Spree
This fundraiser helps our non-profit organization, Whatcom Mountain Bike Coalition, fund a seasonal trail builder position and purchase a new excavator.
Ed Spratt
Apr 15, 2024
 Industry Digest: Crowd Funding 36" eBikes, Canfield Bikes' Relocation, Recalls & More
What's going on in the cycling industry this month?
Alpinestars HQ
Apr 15, 2024
 Alpinestars Announces Spring 2024 MTB Collection
New apparel, protection, and helmets from Alpinestars.
Archive Navigator


2024 Advertiser List
Brands
Bikes
- Trek
- Specialized
- Devinci
- Rocky Mountain
- Giant Bikes
- Scott
- Kona
- Norco
- Commencal
- NS Bikes
- Santa Cruz
- Yeti
- YT Industries
- Polygon Bikes
- Cube
- Radon Bikes
- Marin
- Guerrilla Gravity
- RSD Bikes
- Propain Bikes
- DMR Bikes
- Canyon
- PRIME Bicycles
- Pivot Cycles
Components
- SRAM
- Shimano
- Race Face
- Industry Nine
- SDG
- Deity
- Hunt Wheels
- One Up Components
- KS
- Rotor Bike Components
- Stan’s NoTubes
- Reverse Components
- RideWrap
- PROLOGO
- Yoshimura Cycling
- TRP Cycling
- Galfer USA
- Bikeyoke
- e*thirteen
- Geo Handguards
Suspension
Tires
Accessories
Coaching and Education
Online Retailers
Resorts/Riding
- Trestle Bike Park
- Bike Parks BC
- Fernie
- Crested Butte
- Big White
- Saalbach Hinterglemm
- Whitefish Mountain Resort
- Visit Tucson
- Monument Trails
- Mountain Bike Park City